Search for Companies, Tipsters or Sources…
Companies
Tipsters
Brokers
Sources
Or view the latest share tips
Company Results
Tipster results
Broker results
Sources results
Fund Manager results
Tips from these results
- Avoid RWS Holdings (RWS) by Steve Moore in ShareProphets
- Avoid Halma (HLMA) by Steve Moore in ShareProphets
- Market Perform Wizz Air Holdings (WIZZ) by Bernstein
- Overweight Wizz Air Holdings (WIZZ) by Barclays
- Buy IP Group (IPO) by Deutsche Bank
- Buy Safestore Holdings (SAFE) by Jefferies
- Buy Halma (HLMA) by Citi
- Buy Halma (HLMA) by Goldman Sachs
- Buy Rolls-Royce Holdings (RR.) by Berenberg
- Avoid WH Smith (SMWH) by Steve Moore in ShareProphets
- Hold Barclays (BARC) by James Beard in The Motley Fool
- Watch Wise Class A (WISE) by Edward Sheldon in The Motley Fool
- Avoid Portmeirion Group (PMP) by Steve Moore in ShareProphets
- Hold Anglo American (AAL) by John Ficenec in The Times - Tempus
- Avoid WH Smith (SMWH) by Steve Moore in ShareProphets
- Buy Pennon Group (PNN) by Deutsche Bank
- Neutral Pennon Group (PNN) by Goldman Sachs
- Equal Weight WH Smith (SMWH) by Barclays
- Buy Pennon Group (PNN) by Citi
- Hold WH Smith (SMWH) by Peel Hunt
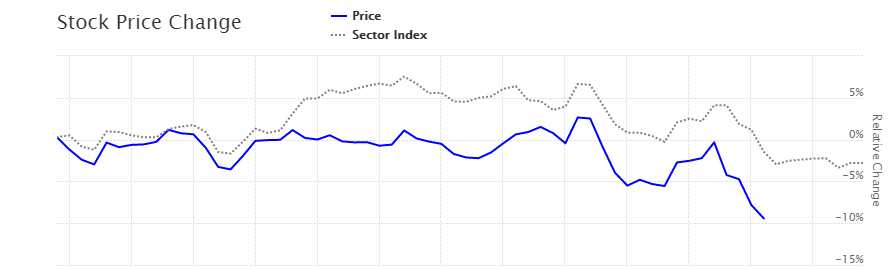
Price Data
This section of the graph displays the historical price movement of the stock (in blue) and the corresponding sector performance (in grey). The percentage change over the time frame is displayed on the right hand side of the graph and by hovering over you can view the stock price and sector index level at any point in time.
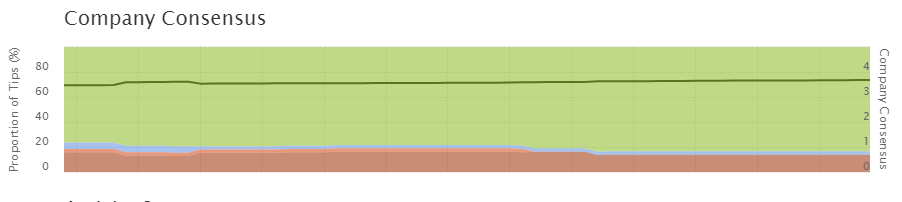
Consensus Data
Company consensus summarise the current market sentiment towards a particular company.
It combines the most recent open tip from each Tipster/Broker to produce a single value to describe market opinion for a company (or sector). A changing consensus score can indicate that market sentiment is shifting towards a particular stock.
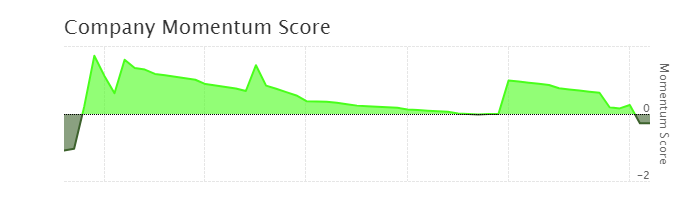
Company Momentum Score
The tip momentum score chart illustrates the swing in analyst sentiment towards the company.
The tip momentum score takes into account the number of new tips the company has recently received and whether these tips were new or sentiment reiterations. A positive value indicates a recent upturn in sentiment towards the company, a negative value indicates a fall in sentiment and a value close to zero indicates no change.
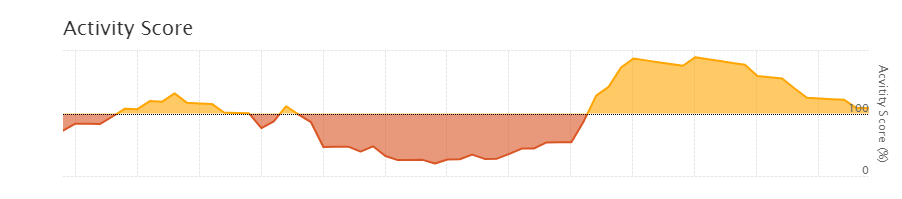
Activity Data
This section of the graph shows the relative level of tipping activity for an individual company. A value of 100% indicates that the company is receiving the normal level of tip activity. A value below 100% indicates it is receiving fewer tips than normal and a level above 100% indicates it is receiving more attention than normal.
A high Activity Score could indicate a number of things such as imminent earning/reporting announcement, shift in sentiment, positive or negative news.
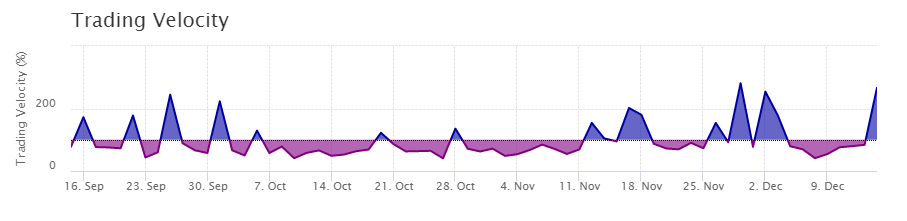
Trading Velocity Data
The final section of the graph shows the relative trading activity for the company. This represents the number of shares traded (the volume) each day and compares to an average day. A value below 100% indicates that the stock is being traded less than usual and a value above 100% indicates that it is being traded more than usual.
A high Trading Velocity indicates that the stock is being traded more than usual and could potentially accompany a change in the price.